Introduction: The goal of this lab was to become familiar with downloading shapefiles and attribute data off the internet in order to build maps based off the downloaded data, and to become familiar with building web maps.
Methods: The first skill learned in this lab was how do identify and download the appropriate shapefiles and attribute data in order to create maps. It was emphasized to start off on the census website to find and download the appropriate population attribute data. Once the data was downloaded, the data had to become unzipped and saved under an excel file. After the attribute data became unzipped, the Wisconsin shapefile had to be downloaded and unzipped in order to provide the spatial attributes. After the proper data was downloaded, two maps were produced: one representing the 2010 population of each county in Wisconsin, the other depicting the 2010 population percentage of citizens in each county ages 10-14 in Wisconsin.
The second skill learned in this lab was to become familiar with creating a web map. Using one of the maps created with the previous data downloaded in this lab, and also using certain arcMap applications, the map was published online on the arcMap website. Editor applications were available on the arcMap website in order to change certain aspects of the map (i.e. proper labeling).
Results: On the "2010 Population per County" map, there seems to be a greater proportion of people living in the southern part of the state versus the northern. While the greater proportion of people tend to live in the southern part of the state, it also seems the population is more concentrated toward the east-central part of the state--so a high proportion of people living in the south-east/south-central part of Wisconsin. With the "2010 Percentage of Population per County Ages 10-14" map, there seems to be no discernible spatial patterns as to which counties exhibit higher percentages of population ages 10-14. Maybe toward northern Wisconsin the percentage of population ages 10-14 is lower comparatively to the southern part of the state, however the data seems spatially scattered between high and low percentages.

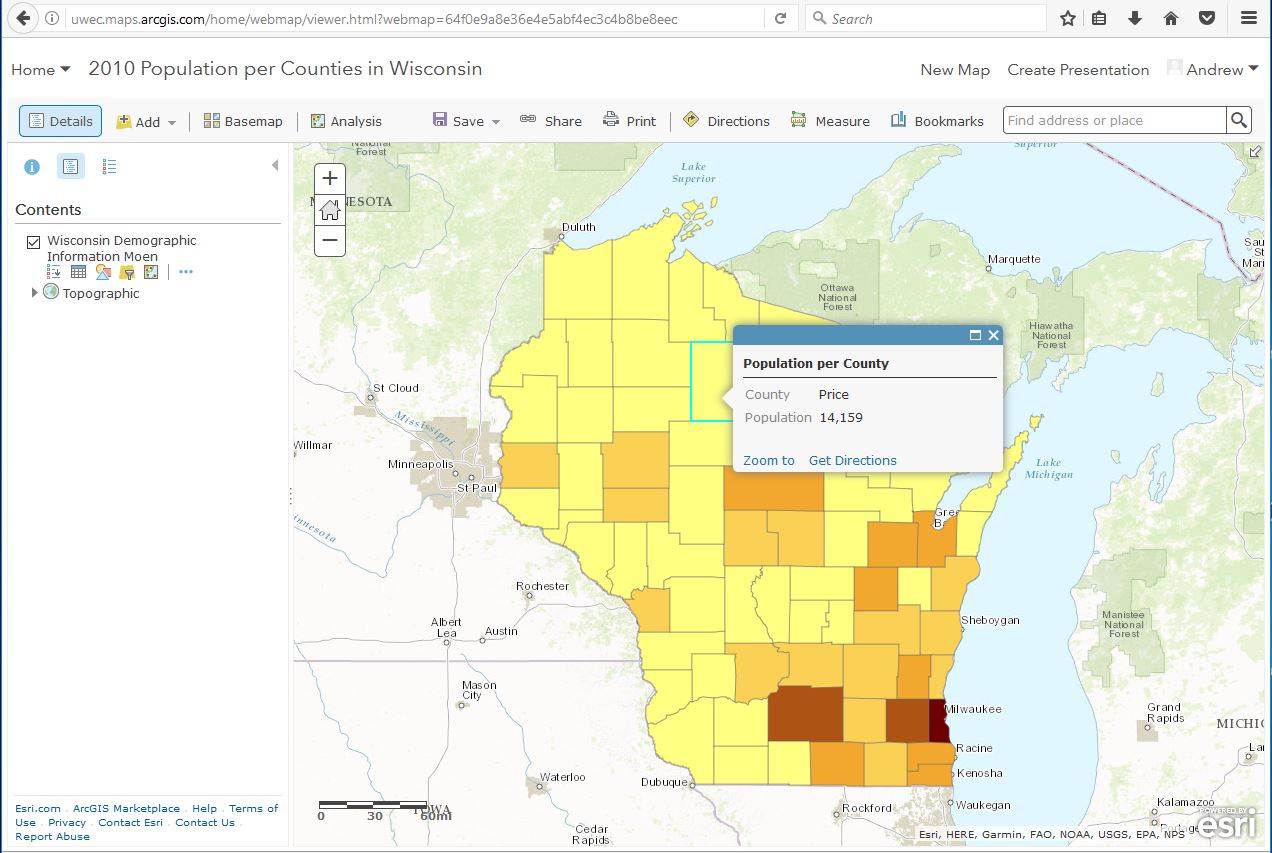
This is the web map created for this lab. The "2010 Population per County" map was uploaded onto the arcGIS website for the creation of this web map. With the online map, there is the ability to use certain tools unavailable in arcMap, like the ability to click on any county and have its population come up (in this map, Price County is clicked on).
Source: The sources for these maps were the US Census for the census data, and ESRI for the base maps.

No comments:
Post a Comment