Background: Black Bears are common in central Marquette County, Michigan, and the DNR wanted to create suitable bear habitats that best suit the needs of the bears, and of the surrounding community. In order to determine the best possible bear habitats, certain characteristics about where the black bears were located needed to be examined, like what kind of forests were the black bears most apt to be located in, or whether or not they were located within 500 meters of a stream. Also, certain characteristics about the surrounding community needed to be taken account, like whether or not the DNR managed the land, and if the land was within 5 kilometers of an urban area in order to provide the best possible location for a bear habitat.
 |
| Figure 1: Workflow Model |
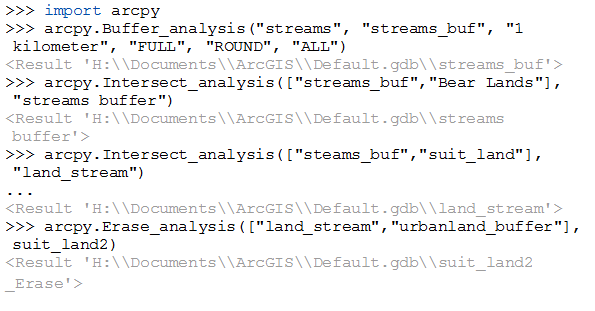 |
| Figure 2: Python Model |
 |
| Figure 3: Map of best possible locations for bear habitat |
Results: The results of the map in Figure 3 suggest a couple of places for bear habitat. It was concluded that a majority of the bears were located within 500 meters of a stream, and were located in either Mixed Forest Land, Forested Wetlands, or Evergreen Forested Land. Stemming from those conclusions, it was originally calculated that the best possible bear habitats would be located in the darker green polygons. However, other factors also needed to be taken into account, like where the urban area was located and whether or not the DNR owned the land. Taking those two factors into account, the final determination for best possible location for a bear habitat is located in the yellow. It seems the majority of the yellow land is located in the central-to-north parts of the study area, with it ranging east to west. It also seems the majority of bears are also located in the central-to north part of the study area, however they don't seem to venture east as much, preferring to habit the west to west-to-central parts of the study area.
Source: Data from State of Michigan Open GIS Data --http://gis.michigan.opendata.arcgis.com/
Landcover from USGS NLCD --http://www.mcgi.state.mi.us/mgdl/nlcd/metadata/nlcdshp.html
DNR Management Units from Michigan DNR- http://www.dnr.state.mi.us/spatialdatalibrary/metadata/wildlife_mgmt_units.htm
Streams from http://www.mcgi.state.mi.us/mgdl/framework/metadata/Marquette.html
No comments:
Post a Comment